What Are 1% Lows? Why Your Game Feels Worse Than Your FPS Counter Says
Two runs can both average exactly 60 FPS while one of them hitches twice a second. The number that tells them apart is the 1% low. Here's what it actually measures, why frame time in milliseconds is the honest unit, how to read a frame-time graph, and how to test your own PC in about ten minutes.
By Shujaat Ahmed · · · 8 min read
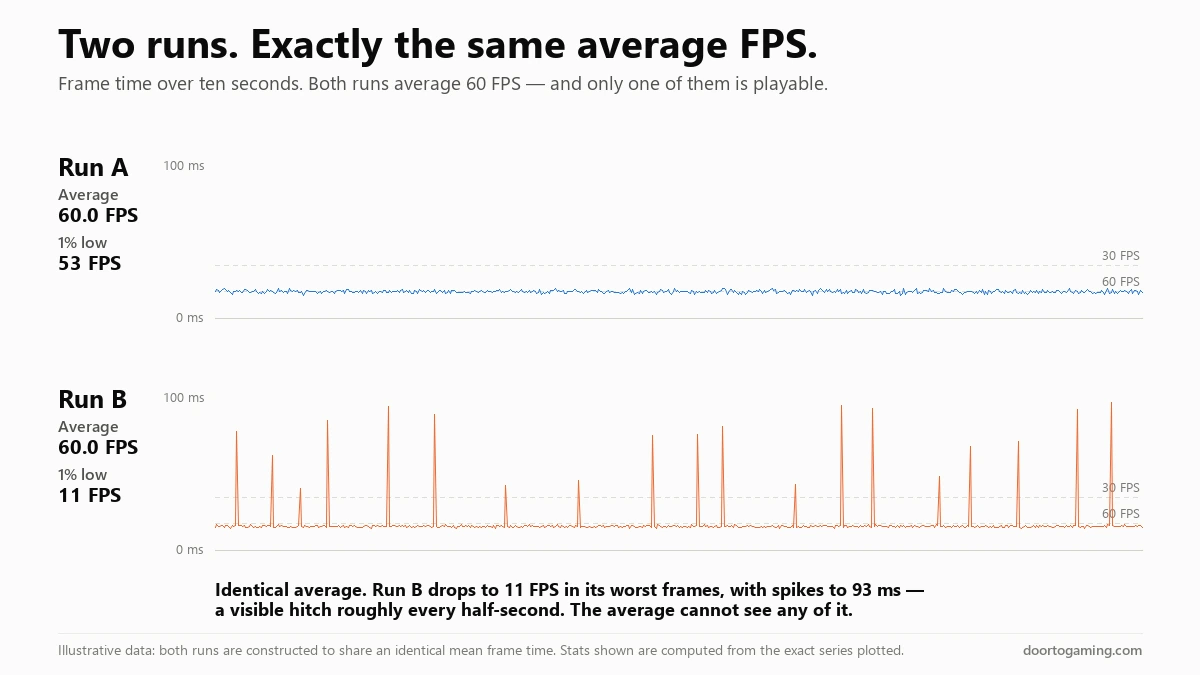
Look at the two traces at the top of this page. Both runs average exactly 60 FPS. One of them is perfectly smooth and the other hitches roughly twice a second, hard enough that you would notice it within about four seconds of playing.
If you only had the average frame rate to go on, those two runs are identical. That is the whole problem with the number almost everyone uses to judge performance.
The metric that can tell them apart is the 1% low — 53 FPS in the first run, 11 in the second. It's printed in every decent benchmark and misunderstood by most people reading them, so here's what it actually means, how to read it, and how to measure it on your own machine in about ten minutes.
What a 1% low actually is
A 1% low is not "the lowest frame rate you hit." It's not a single bad moment, and it isn't the same as the minimum.
Here's the actual calculation. The benchmark records how long every single frame took to render, in milliseconds. It sorts all of those frames from slowest to fastest, takes the slowest 1% of them, averages those frame times, and converts that average back into a frame rate.
So a 1% low of 11 FPS means: the worst one percent of your frames took, on average, about 91 milliseconds each. Over a ten-second session at 60 FPS that's roughly six frames — six moments where the image froze for about a tenth of a second.
It's the same thing as the 99th percentile of frame time, just expressed in a unit gamers recognise. And because it averages the worst 1% rather than picking the single worst frame, it's resistant to being thrown off by one freak stall, which is exactly what makes it useful. One bad frame is noise. A consistently bad worst-1% is a pattern you will feel.
You'll also see 0.1% lows reported. Same calculation, worst tenth of a percent. That one catches the rare, severe stalls — a shader compiling, a level streaming in — that are too infrequent to move the 1% figure but very obvious when they happen.
Frame time is the real unit. FPS is a derived one.
This is the conceptual hurdle, and it's worth clearing because everything else follows from it.
Your GPU does not produce "frames per second." It produces one frame, then another, each taking some number of milliseconds. Frames per second is just a count of how many of those fit into a second — an average, by construction, over a one-second window. The moment you average something, you lose the spikes inside it.
Frame time is also the more honest scale, because FPS is a reciprocal and behaves counter-intuitively at the edges:
- 120 FPS = 8.3 ms per frame
- 60 FPS = 16.7 ms
- 30 FPS = 33.3 ms
- 20 FPS = 50 ms
Dropping from 120 to 60 costs you 60 frames per second but only 8.4 ms. Dropping from 30 to 20 costs you just 10 frames per second but a much larger 16.7 ms. The second drop is roughly twice as damaging to how the game feels, despite looking six times smaller on an FPS counter. This is why two cards separated by "15 FPS" can feel identical at the top of the range and worlds apart at the bottom.
What you perceive as smoothness is really consistency of frame time. A rock-steady 45 FPS feels better than a 60 FPS average that keeps lurching.
How to measure it on your own PC
Three tools, depending on how seriously you want to look.
For a live overlay: MSI Afterburner with RivaTuner Statistics Server (RTSS) — RTSS is a separate install and does the actual on-screen drawing. Put frame time on the overlay, not just FPS, and enable the graph rather than the number. This is the fastest way to catch a problem in the act.
For real analysis: CapFrameX. It's free, it wraps Intel's PresentMon underneath, and it records a session you can study afterwards — frame-time graphs, percentile breakdowns, and side-by-side comparison of two runs. If you want to prove a settings change actually helped, this is the tool. Nvidia's FrameView does a similar job and additionally logs per-frame DLSS and frame-generation behaviour on RTX cards.
For the underlying data: PresentMon itself, from Intel, is what most of the consumer tools are built on. You rarely need it directly.
Whichever you use, the method is the same: play the game normally for ten to fifteen minutes, in the parts where it feels bad — not a 30-second canned benchmark. Short scripted runs are the single most common reason a problem doesn't show up in testing, which is also why 8GB graphics cards look better in reviews than they behave in practice.
How to read the graph
A frame-time graph puts milliseconds on the vertical axis and time on the horizontal. Lower is faster. You are looking at the shape, not the height.
- A flat line, even a highish one, is good. That's consistency. Run A above is a flat line.
- Isolated tall spikes are hitches. Each one is a visible stutter. Count them — if they're periodic, that tells you something about the cause.
- A fuzzy, noisy band is frame-pacing instability. Often felt as a subtle judder even when the average looks fine.
- A staircase that steps up and stays up usually means thermal or power throttling.
The rough rule of thumb: if your 1% low sits at roughly two-thirds of your average or better, the game will feel smooth. If it's below half, you will feel it whether or not you can name what you're feeling. Run B's 11 against 60 is not a subtle case.
What actually causes bad 1% lows
Most stutter comes down to something arriving late, and the cause determines the fix:
- Shader or PSO compilation. The game compiles a shader the first time an effect appears. Classic symptom: bad on first playthrough of an area, fine afterwards. Very common in Unreal Engine 5 titles.
- Asset streaming and traversal. Hitches when you cross a threshold, turn a corner fast, or fly across a map. Storage speed matters here; an NVMe drive genuinely helps.
- VRAM exhaustion. The card runs out of local memory and starts fetching across the PCIe bus. Distinctive because it comes with texture pop-in, and it worsens the longer you play. Covered in detail in our piece on what 8GB cards actually do when they run short.
- CPU spikes. A single-threaded bottleneck, a background process, or a shader cache rebuild after a driver update. GPU utilisation drops during the hitch rather than staying pinned.
- Thermal or power throttling. Performance is fine for a few minutes, then steps down and stays down.
The useful diagnostic is to watch GPU utilisation alongside frame time. If utilisation stays high while frames spike, the GPU is busy and the problem is likely memory or streaming. If utilisation drops during a spike, the GPU is waiting on something — usually the CPU or storage.
If you need to find the settings to test any of this, Nvidia moved most of them during its software overhaul, and we mapped where every Control Panel setting ended up.
Why this quietly distorts hardware reviews
Most published benchmarks lead with average frame rate. Many report nothing else.
That's a methodology inherited from an era when frame delivery was fairly uniform and the average was a decent summary. It is a poor fit for modern games built on streaming-heavy engines, where the interesting failures are brief, severe and invisible to a mean. A card can post a competitive average and still deliver a measurably worse experience — and the review will show the first fact and not the second.
It's the same distortion we ran into when comparing consoles on their spec sheets: the headline number is real, it's just answering a narrower question than the one you're asking.
So when you read a benchmark, look for the 1% low. If an outlet doesn't publish it, you're being shown half the result.
The short version
- The 1% low is the average of your slowest 1% of frames, converted back to FPS. It is the number that tracks how smooth a game feels.
- Frame time in milliseconds is the real measurement; FPS is a per-second count derived from it, and averaging hides exactly the spikes you notice.
- Aim for a 1% low at two-thirds of your average or better.
- Measure with RTSS for a live graph or CapFrameX for proper analysis, during real play — not a 30-second benchmark run.
- The shape of the frame-time graph tells you the cause: spikes, fuzz and staircases all mean different things.
Put a frame-time graph on screen once and you'll stop trusting your FPS counter. That's the correct response.
Tags: PC Gaming GPU Benchmarks Game Settings Frame Time & Stutter 1% Lows Frame Time PC Performance Game Stutter CapFrameX MSI Afterburner
Written by Shujaat Ahmed
Shujaat Ahmed is the founder and editor of Door To Gaming. A lifelong gamer, he writes about the games, hardware, and industry news he cannot stop thinking about.